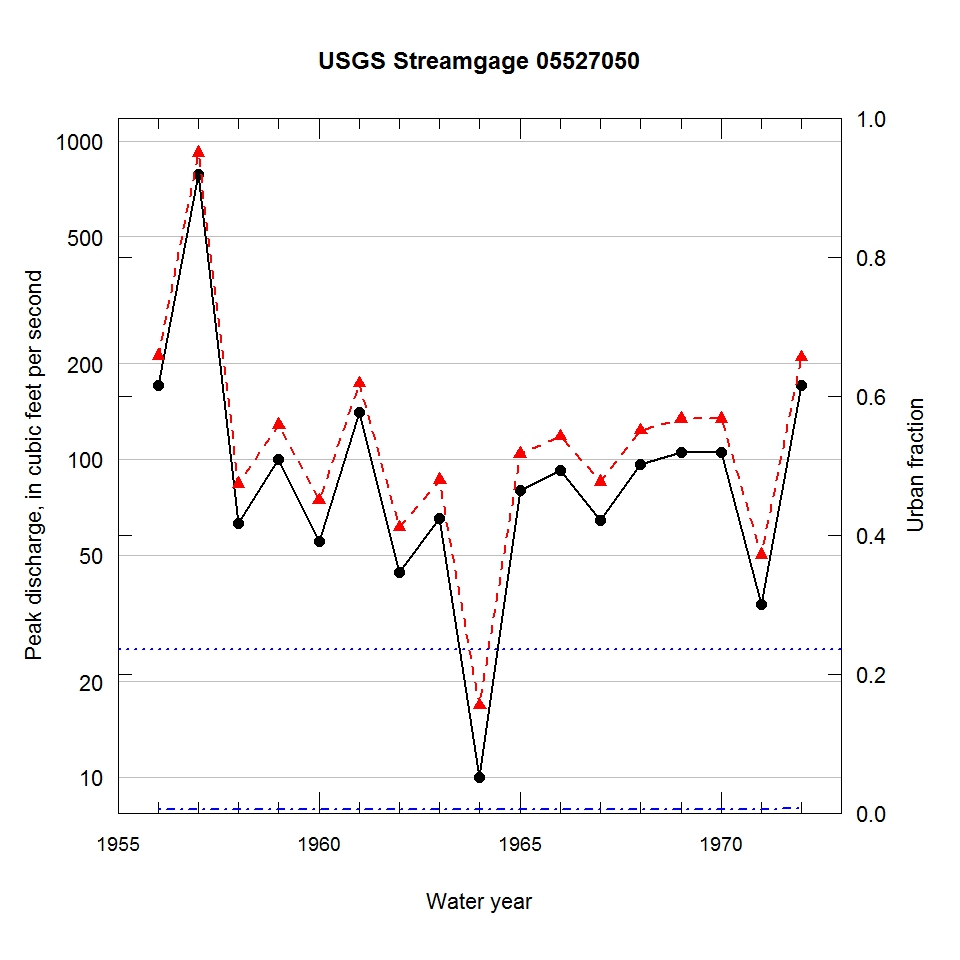
Observed and urbanization-adjusted annual maximum peak discharge and associated urban fraction and precipitation values at USGS streamgage:
05527050 PRAIRIE CREEK NEAR FRANKFORT, IL


| Water year | Segment | Discharge code | Cumulative reservoir storage (acre-feet) | Urban fraction | Precipitation (inches) | Observed peak discharge (ft3/s) | Adjusted peak discharge (ft3/s) | Exceedance probability |
| 1956 | 1 | -- | 0 | 0.005 | 0.634 | 171 | 211 | 0.106 |
| 1957 | 1 | -- | 0 | 0.005 | 3.145 | 786 | 917 | 0.000 |
| 1958 | 1 | -- | 0 | 0.005 | 0.606 | 63 | 84 | 0.691 |
| 1959 | 1 | 2 | 0 | 0.005 | 1.362 | 100 | 128 | 0.387 |
| 1960 | 1 | -- | 0 | 0.005 | 0.412 | 55 | 74 | 0.757 |
| 1961 | 1 | -- | 0 | 0.005 | 1.458 | 140 | 173 | 0.188 |
| 1962 | 1 | -- | 0 | 0.005 | 0.302 | 44 | 61 | 0.837 |
| 1963 | 1 | 2 | 0 | 0.005 | 1.439 | 65 | 86 | 0.674 |
| 1964 | 1 | 2 | 0 | 0.005 | 1.019 | 10 | 17 | 1.000 |
| 1965 | 1 | -- | 0 | 0.005 | 0.979 | 80 | 104 | 0.545 |
| 1966 | 1 | -- | 0 | 0.005 | 1.580 | 92 | 118 | 0.443 |
| 1967 | 1 | -- | 0 | 0.005 | 1.181 | 64 | 85 | 0.682 |
| 1968 | 1 | -- | 0 | 0.005 | 1.676 | 96 | 123 | 0.413 |
| 1969 | 1 | -- | 0 | 0.005 | 0.713 | 105 | 134 | 0.357 |
| 1970 | 1 | -- | 0 | 0.005 | 1.722 | 105 | 134 | 0.357 |
| 1971 | 1 | -- | 0 | 0.006 | 0.289 | 35 | 50 | 0.895 |
| 1972 | 1 | -- | 0 | 0.006 | 1.563 | 170 | 209 | 0.109 |

